Pipeline Data Processing
Solutions ![]() Oil & Gas, Energy, Mining
Oil & Gas, Energy, Mining ![]() Pipeline Strain Monitoring
Pipeline Strain Monitoring
Processing Pipeline Data
What does all of this data mean?
Structural integrity problems are particularly serious where river crossings are involved due to the undercutting effect on slope by continuous hydraulic erosion, and in regions subject to seismic risk and the resultant slope instability.
Below are two example case studies of how pipeline strain data looks and how it is interpreted.
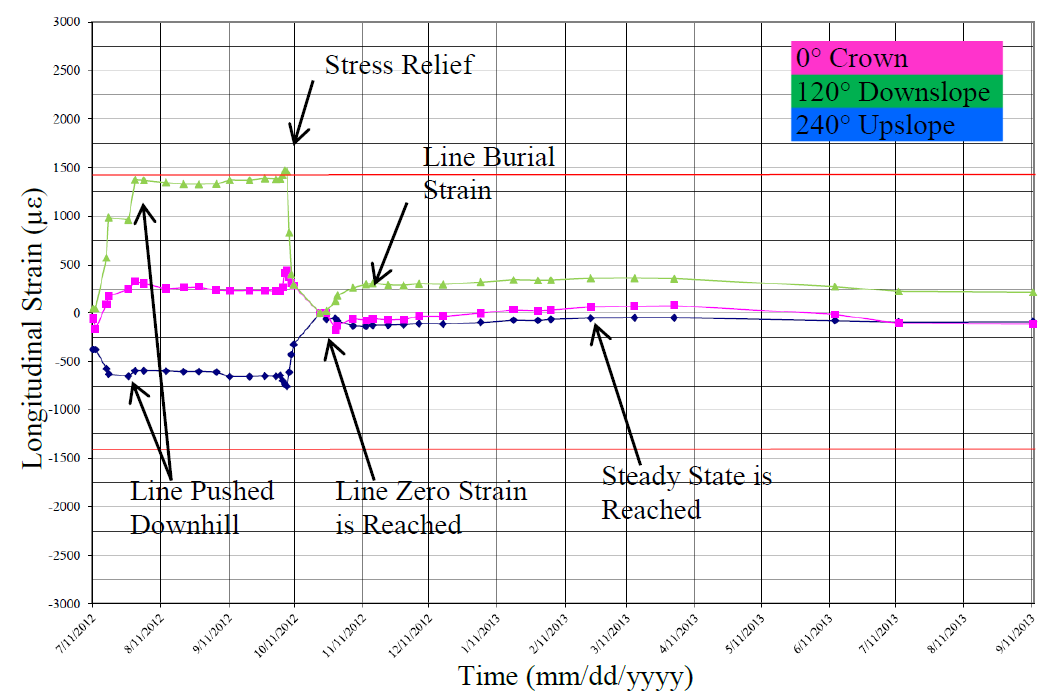
Example #1 - Side-bend StressAs a localised slumping failure develops the pipe moves downhill, it is dragged downslope by the traction of the surrounding soils. This causes a side bend in the pipe which is indicated by the downslope longitudinal gauge going well into tension and the uphill longitudinal gauge going into compression. It can also be noted that in this scenario, the downslope gauge approaches a strain limit (red-line) as determined by regulatory standards for this type of pipe. Once the limit was reached, in late 2012, field operations were able to complete a stress relief on the section of line which is shown in the stress relaxation. Although some strain is still present, the magnitude has been significantly reduced.
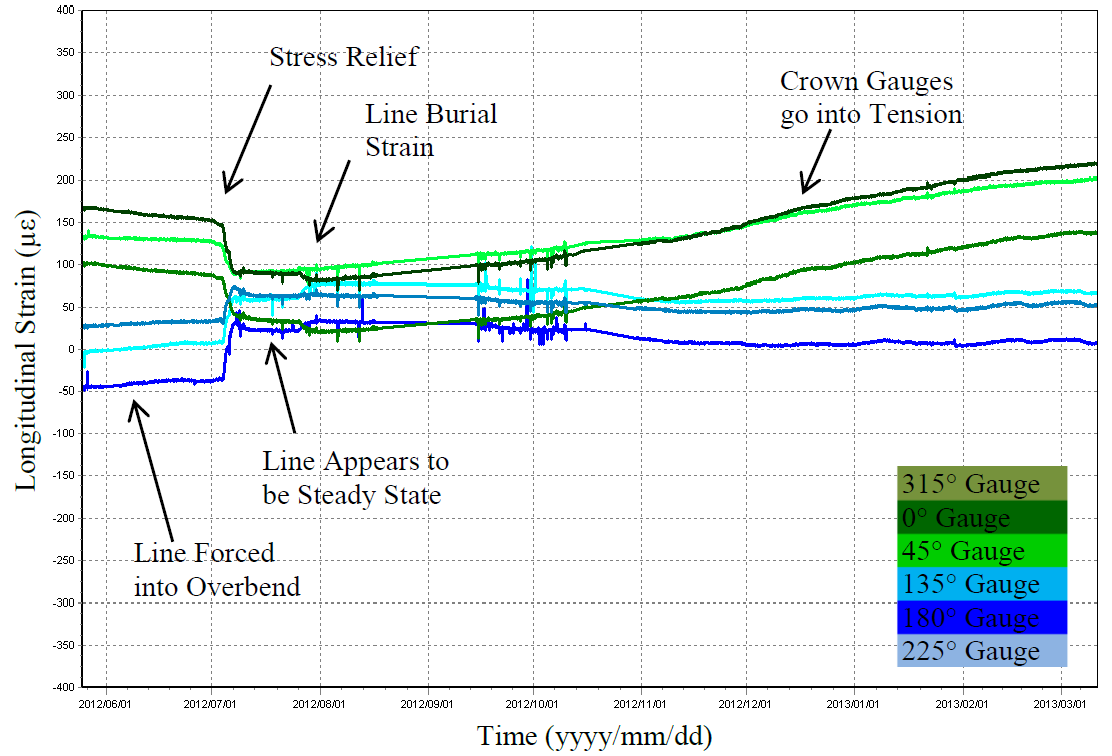
At the start of the data plot, we see the tensile strains occurring in the crown (top of pipe) gauges. The maximum tensile strain is seen at the 0° gauge which is the mirror image of the compressive strain which is seen in the 180° gauge but of greater magnitude. This station, which is situated on an overbend, shows that the line is being pulled downhill which is forcing this section further into an overbent position.
Similarly, after reviewing the supplied data, the operator was able schedule a stress relief for the line. Once this was completed and the line was then backfilled. Over the next year, the gauges indicated that the crown gauges again went into tension.