![]() MONITORING SOLUTIONS / PIPELINE INTEGRITY MONITORING
MONITORING SOLUTIONS / PIPELINE INTEGRITY MONITORING
White Paper
Title: Methods of Monitoring Induced Strain for Oil and Gas Pipelines
By: Iain Weir-Jones, Ph.D., P. Eng., FGS, and
Colin Cindrich, B.A.Sc., P. Eng.
Executive Summary
Oil and Gas pipelines and their associated structures always present a potential threat to the environment. Deterioration of the pipelines can result from natural causes, seismic events, abnormal weather conditions, unauthorized human interventions, or from a failure of the owner/operator to recognize signs of decreasing integrity – characterized as risk.
For many years, the Weir-Jones Group has used a variety of technologies to monitor remotely and continuously, the long term structural integrity of oil and gas pipelines. This White Paper describes a number of autonomous, integrated and cost effective methods of assessing the integrity of continuous or discrete portions of the pipelines by using fibre optic or electrical strain gauge technology to detect early-state movements on or around the structure. These range from discrete measurements at a specific location deemed to be at risk, to much more general systems monitoring kilometers of pipe. The technologies are totally passive, and can be operated with minimal human intervention.
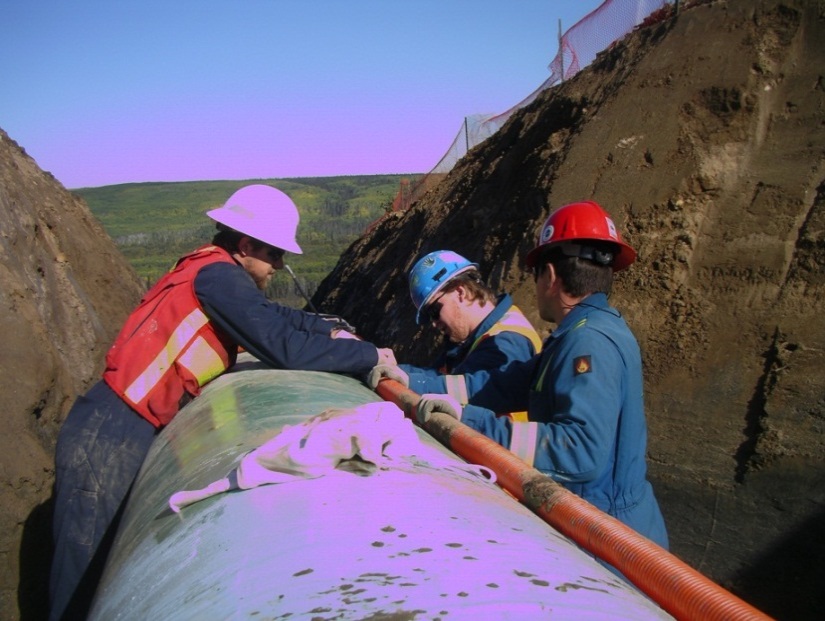
Figure 1: Weir-Jones Personnel Installing Strain Monitoring Sensors onto a 36" Pipeline
Failures invariably have a serious and undesirable impact on a pipeline operator. They can cause fatalities, massive environmental damage and have an adverse impact on public attitudes. Whatever the application, data is collected and processed in real-time, and an integrated risk management strategy is provided for the owner/operator. The cost of implementing and operating these monitoring strategies is a tiny fraction of the direct and indirect costs associated with remediating the failure of a pipeline.
Introduction
It is widely accepted that very few natural or mechanical processes occur instantaneously, there are almost always precursor events which occur over a finite period of time, and these characteristically increase in frequency, rate and magnitude as failure approaches. Progressive pipeline failures on slopes, for example, are frequently preceded by a relaxation and displacement of its surrounding ground. Damage to the pipeline from earthquakes and volcanic eruptions are often preceded by swarms of minors tremors, or, in the case of earthquakes, by the arrival of the less damaging p-wave. Corrosion failures typically commence with localised pitting, or changes in the electro-chemical potential around the pipe. Pipelines may display some of the following symptoms depending upon the prevailing conditions however; these can all be used to warn of the potential loss of pipeline integrity:
- Settlement of the soil may occur at the crest of the slope, tension cracks may develop. Soil fraction forces on the pipe may induce tensile stresses in the pipe.
- Heaving of the soil down the slope or at the toe may induce compressive stresses and ultimately buckling of the pipe.
- Soil traction on the pipe may induce compression at the slope toe and/or tension at the slope crest.
- If localized rotational failures occur on the slope, downslope portions of the pipe may be elevated while higher sections may settle.
Displacement monitoring of pipelines to assess structural integrity, and hence long term stability, is not a new technology. Weir-Jones has carried out hundreds of projects over the last 35 years; the traditional methods used to detect signs of movement relative to surrounding ground are instruments such as inclinometers, settlement sensors, extensometers, electrical strain gauges, etc. They are however costly and do not always lend themselves to autonomous monitoring.
Fortunately, in conjunction with the owner’s demand for more cost effective real-time structural integrity monitoring systems, it has become feasible to carry out direct deformation monitoring utilizing autonomous distributed and discrete strain sensing systems. The more traditional electrical resistive strain gauge can still be effectively utilized, however, the fiber optic technologies such as Fiber Bragg Grating (FBG) and Brillouin Optical Frequency Domain Analysis (BOFDA) have opened up more possibilities in strain analysis. Whichever technology suits the project requirements, Weir-Jones has experience in the integration of each of these technologies allowing the end-user to gain useful operational knowledge from the system. Systems operate autonomously and report to Weir-Jones in Vancouver, and also to stakeholders. This data can be used in routine operation or to implement various automated risk/hazard mitigation actions.
Weir-Jones has extensive experience designing, installing and 24/7 monitoring of structural integrity monitoring systems in the infrastructure (railroad, tunnels, bridges, etc) in addition to the energy sector (pipeline, upstream, offshore, etc.) for assets throughout Canada, US and the Middle East. The technologies, their system architectures and the results which can be obtained are discussed below.
Strain Monitoring Technology
Weir-Jones through their 30+ years of pipeline strain monitoring has constantly evaluated new emerging technologies and then refined the implementation of these meet the specific requirements of the end user. Currently, there are 3 primary technologies which Weir-Jones supports and is actively installing. The first is Discrete Resistance Foil strain gauges which are an older electrical technology which still can be effectively implemented. The second is the Fibre Bragg Grating (FBG) fibre optical strain gauge which allows for multiple gauges to be installed on a single fibre line. The third is a distributed fiber optic strain sensing line which can monitor strain continuously along the length of coupled fiber.
Discrete Resistance Type Foil Sensing
The weldable full-bridge strain gauge is a basic long-term solution for pipeline strain monitoring applications. Foil gauges are mounted to stainless steel shim in a full bridge orientation and then encased in an IP68 mould. Cables are routed to a central location where strain gauge conditioners and data acquisition equipment is housed. The grouping of resistance foil gauges which are mounted at each of the desired locations will make up a “Station.” The station will be connected to the data collection unit located at a distance of up to 1km away.
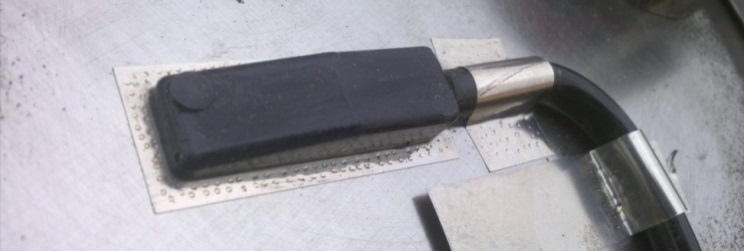
Figure 2: Full Bridge 350Ω Weldable Resistance Strain Gauge
Advantages/Disadvantages of Discrete Resistance Sensing:
Quasi-Distributed Fibre Optic Sensing (FBG).
Fibre Bragg Gratings along single-mode fibres are packaged into discrete weldable strain gauges. FBG gauges of differing nominal frequencies and types are joined in series to allow for 10’s of gauges to be monitored on 1 channel which creates a “Station.” An optical interrogator completes sensor identification, interrogation and temperature compensation of distances of up to a few kilometres.
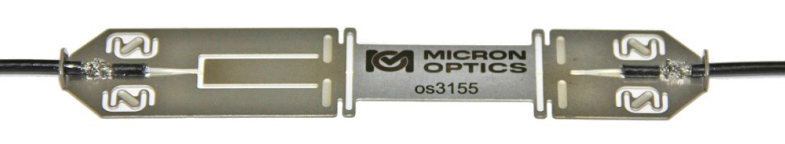
Figure 3: Micron Optics os3155 Strain Gauge with Temp. Compensation
Advantages/Disadvantages of Quasi-Distributed FBG Sensing:
Fully Distributed Fibre Optic Sensing (Brillouin)
A distributed system will provide an equivalent of a discrete sensor for every meter of fibre installed. Distributed strain monitoring allows for continuous sensing along 10’s of kilometers of a loop of single mode optical fibre. The ends of the fibre are terminated at the input and output ports of a Brillouin Optical Frequency Domain Interrogator, the optical pulse is generated at the interrogator and analyzed upon its return. The tight fibre, shown below, is coupled to the protective jacket and thus to the surrounding ground, allowing for strain transfer of up to ± 3% (±30,000µε) from the medium in which it is installed. Due to the cost of the monitoring equipment, systems tend to only be cost effective at large monitoring lengths (>1km) and several hundred measuring points.
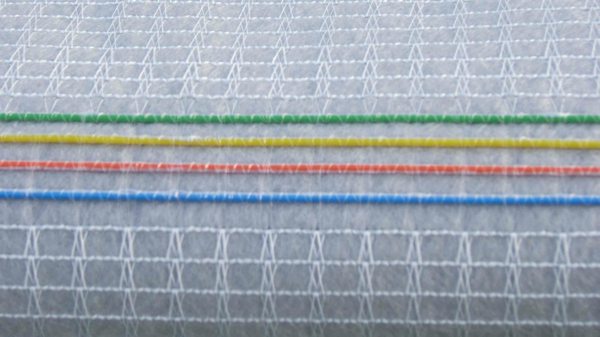
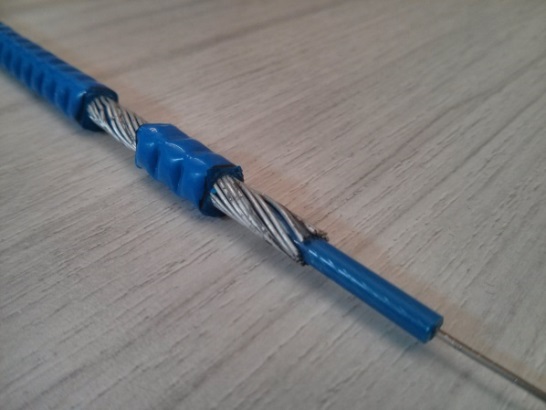
Figure 3: a) Sample of Geotextile with embedded Fibre Optic lines. b) Direct Burial or Downhole Type Fibre Optic Line.
Advantages/Disadvantages Fully Distributed Brillouin Sensing:
Functional Description
When using Discrete or Quasi-distributed systems, site specific points of interest will be identified during design. Each of these points of interest which will be monitored by a grouping of strain gauges called a “Station.” Points of Interest may include;
- Overbends,
- Underbends,
- Side-Bends or expansion loops,
- Girth Welds, or
- Road/Water Crossings.
An example of a discrete system station layout is shown below. The specific points of interest which were chosen in this example are the crest of the hill, the overbends along the hillside, then the expansion loop, and finally the base of the slope.
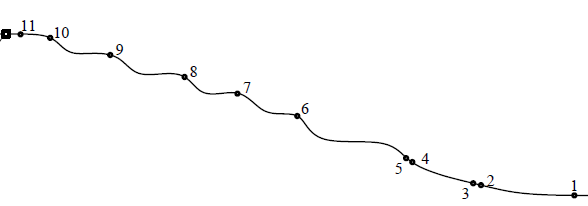
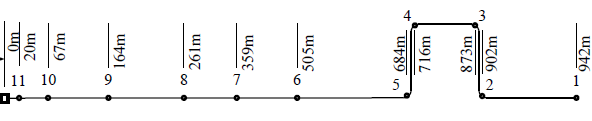
Figure 4: Elevation of a Sample 11 Station Strain Monitoring System Spanning ~1km
Each of these station locations would have a string of discrete strain sensors arranged around the circumference of the pipe measuring the longitudinal strain. Whether discrete or continuous, the sensors will be laid on specific axis on the circumference of the pipe. Three types of configurations are typically employed depending on the requirements of the project; 3, 4 and 6 axis positions as shown below.
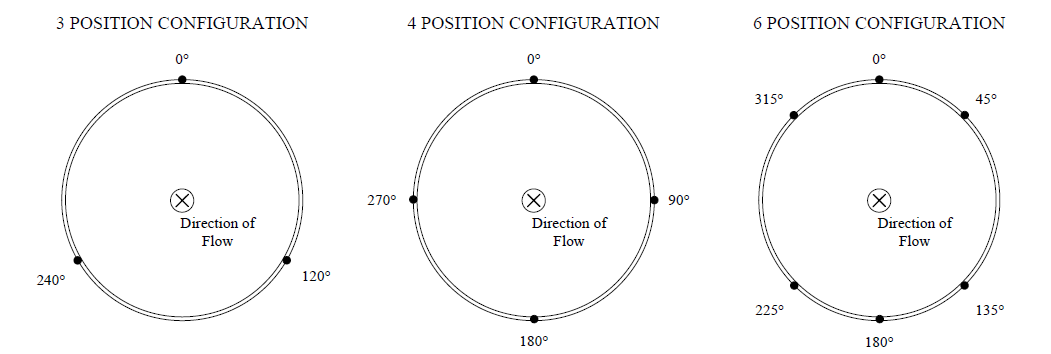
Figure 5: Typical Discrete Sensor location
The gauge positions allow for a detailed analysis of the longitudinal and transverse strain state of the pipe. Temperature sensors can also be installed on any of these locations to allow for temperature measurement and compensation. Once data is collected, analysis may commence. Where +ve strain is tension and –ve is compression. Below are some examples of remote pipeline monitoring where a line is running through an unstable slope often consisting of post glacial Holocene silts and clays.
The first example as shown in the figure below is of a pipeline which is installed transversely across a slope. As a localised slumping failure develops the pipe moves downhill, it is dragged downslope by the traction of the surrounding soils. This causes a side bend in the pipe which is indicated by the downslope longitudinal gauge going well into tension and the uphill longitudinal gauge going into compression. It can also be noted that in this scenario, the downslope gauge approaches a strain limit (red-line) as determined by regulatory standards for this type of pipe. Once the limit was reached, in late 2012, field operations were able to complete a stress relief on the section of line which is shown in the stress relaxation. Although some strain is still present, the magnitude has been significantly reduced.
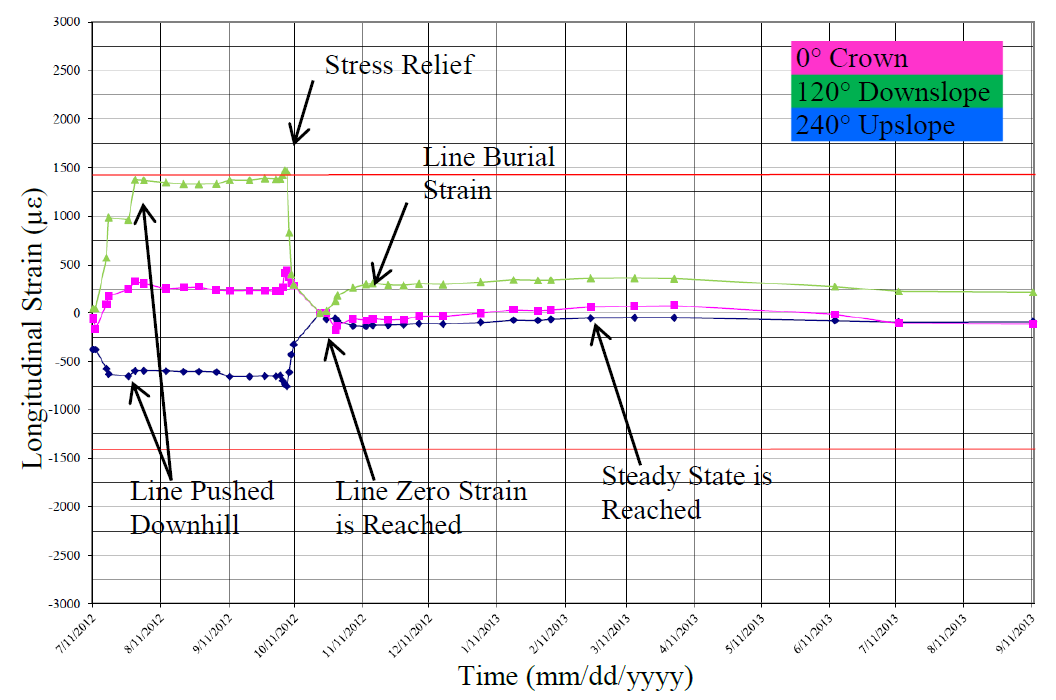
Figure 6: Side-bend Stress
In another example shown in the following figure, we see an example of a 6 sensor arrangement. At the start of the data plot, we see the tensile strains occurring in the crown (top of pipe) gauges. The maximum tensile strain is seen at the 0° gauge which is the mirror image of the compressive strain which is seen in the 180° gauge but of greater magnitude. This station, which is situated on an overbend, shows that the line is being pulled downhill which is forcing this section further into an overbent position.
Similarly, after reviewing the supplied data, the operator was able schedule a stress relief for the line. Once this was completed and the line was then backfilled. Over the next year, the gauges indicated that the crown gauges again went into tension.
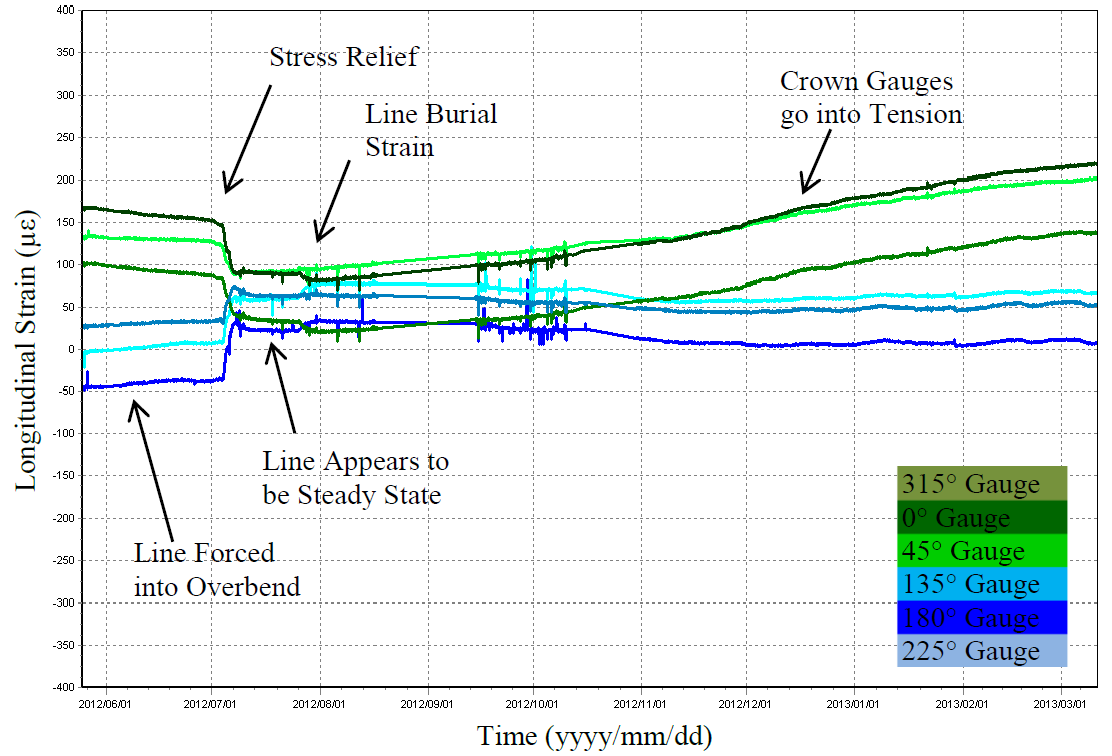
Figure 7: Over-bend Stress– Longitudinal Strain Reduction in Line Pipe by Repositioning Uphill
The information collected by the strain sensors is interrogated remotely and automatically via data collection and communications equipment. This equipment is typically controlled remotely which also allows for transmission of the numerical data. The collected data can processed and displayed in a number of ways, which are selected to meet the end users’ specific needs, it is then delivered to the stakeholders in real-time or in an ongoing report.
Once the processed and analysed data is passed onto the pipeline operator or other consultants, it can be used for various purposes such as field operations.
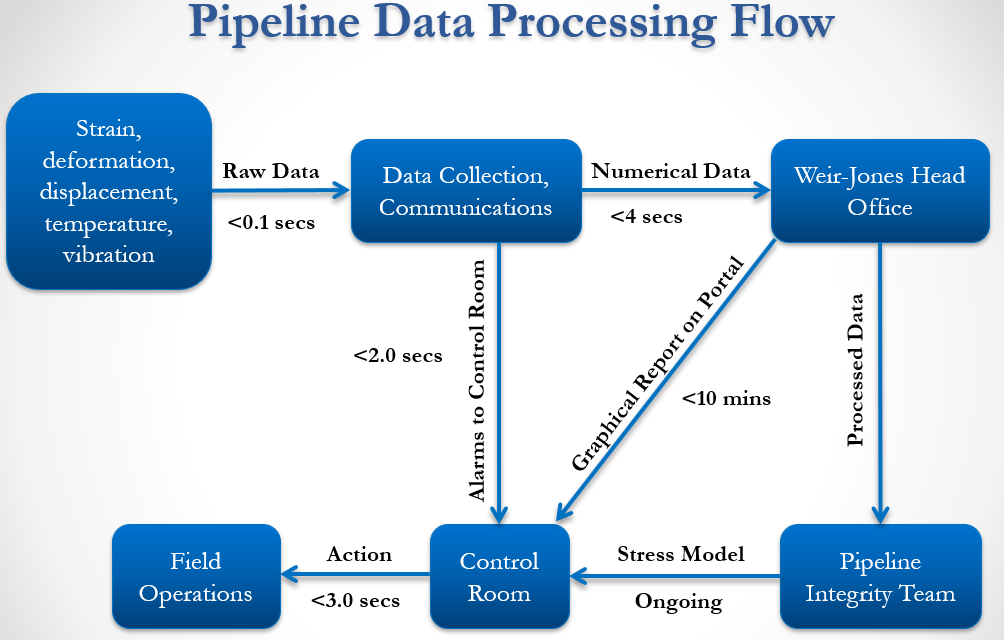
Figure 8: Strain Monitoring Information Flow-Chart
Summary
A significant potential risk exists when critical projects are constructed in environmentally sensitive areas where geotechnical or seismic hazards are present. Regardless of the required monitoring program, having direct pipeline structural integrity data available to the operator on an ongoing basis provides an unparalleled understanding of the ongoing health of the asset being monitored. Strain monitoring systems can be tailored to the specific application requirements allowing for monitoring of localised conditions on new or existing lines or monitor an entire pipeline network . The data can be delivered in a cost effective manner to multiple stakeholders in near real-time, minimizing the risk of events spiraling out of control. This ensures that appropriate responses can be developed in a timely manner.
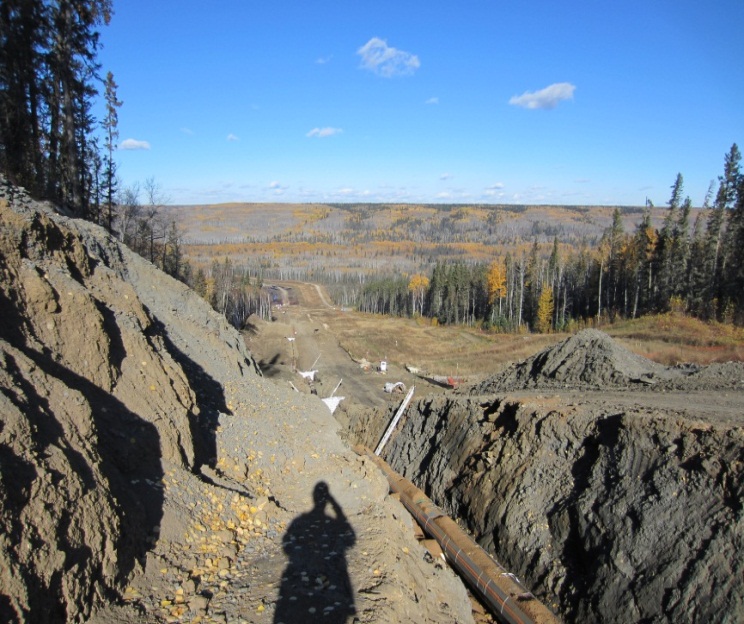
Figure 9: Weir-Jones FBG Installation in Northern Alberta
Weir-Jones, as an integrator of specialized monitoring systems, is dedicated to the advancement of geotechnical and infrastructure monitoring through the use of the most advanced technologies available. Localized or distributed strain monitoring systems have the ability to provide integral operations information to owners which allows for mitigation of the risk involved.